


General Mills reported its fiscal year 2026 results on July 1, 2026, and the top line of the income statement is striking in a way that demands explanation. The company posted a full-year diluted loss per share of $0.16 against earnings of $4.10 per share the prior year, and reported a quarterly operating loss of $2.1 billion in the fourth quarter alone. For any CPG operator or finance professional reading those numbers, the instinct is to ask what went wrong. The honest answer is that almost nothing went wrong on an operational basis. What happened is a useful case study in the difference between GAAP reported earnings and adjusted operating performance, and why the two can tell completely different stories about the same company in the same period.
The gap between reported and adjusted results in fiscal 2026 was driven almost entirely by three categories of non-cash charges. First, General Mills recorded $1.8 billion in goodwill and brand intangible asset impairment charges, driven by an increase in discount rates triggered by a decline in its market capitalization and stock price during the fourth quarter. These impairment charges are required under GAAP when the carrying value of an asset exceeds its fair value, but they represent an accounting adjustment to asset values on the balance sheet rather than actual cash leaving the company. Second, the company recorded a $1.03 billion non-cash valuation loss related to its planned divestiture of its Brazil business, reflecting the difference between the asset carrying value and the expected net proceeds from the sale. Third, the company recognized $156 million in restructuring, transformation, and other exit costs tied to ongoing supply chain initiatives. None of these items affected the company’s cash generation capacity in fiscal 2026.
Chart: General Mills fiscal 2026 full year GAAP reported results vs. adjusted operating results, illustrating the impact of non-cash charges.
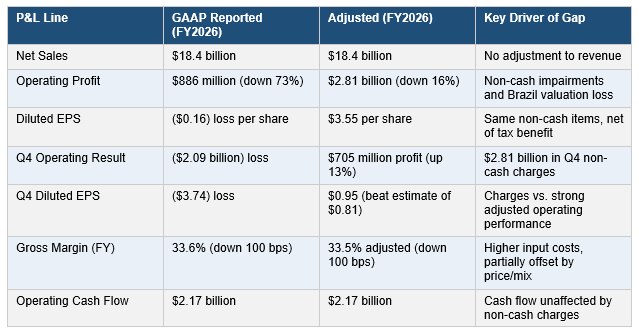
On an adjusted basis, the operational picture is one of gradual recovery rather than distress. Adjusted diluted EPS of $0.95 in the fourth quarter beat the analyst consensus estimate of $0.81 by 17%, and the company generated $2.17 billion in operating cash flow for the full year. Adjusted operating profit margin improved 160 basis points in the fourth quarter to 15.3%, driven by favorable price realization and a more efficient cost structure. Segment level results tell a story of divergence: the North America Retail segment, which includes brands like Cheerios, Nature Valley, Pillsbury, and Betty Crocker, saw full year segment operating profit decline 20% driven by lower volumes from the yogurt divestiture and higher input costs. The North America Pet segment held essentially flat on operating profit, while North America Foodservice operating profit fell 6% and the international segment nearly doubled its operating profit year over year.
The most significant forward-looking element of the fiscal 2026 release is the announcement of a $3 billion cumulative cost savings target to be achieved by fiscal 2030. Approximately $2 billion of that target is expected to come from the company’s ongoing Holistic Margin Management productivity program, which targets roughly 4% of cost of goods sold in annual savings. The remaining $1 billion is targeted through a global transformation initiative that includes redesigning the supply chain network, streamlining business processes, and driving efficiency across the broader cost base. The company expects to deliver at least $750 million of the $3 billion total in fiscal 2027 alone. For CPG peers and retail operators watching the sector, this announcement reflects a broader industry trend: large CPG companies that absorbed significant cost inflation over the past several years are now aggressively attacking their cost structures to restore profitability margins that have not recovered to pre-inflation levels.
The fiscal 2027 guidance reflects a company navigating a challenging consumer environment while executing a significant operational transformation. General Mills guided for organic net sales growth between down 1.5% and up 0.5%, and adjusted diluted earnings per share between $3.00 and $3.20, representing a further decline from the $3.55 delivered in fiscal 2026 largely due to the lapping of a 53rd fiscal week, normalizing incentive compensation, and the impact of completed divestitures. Free cash flow conversion is targeted at approximately 95% of adjusted after-tax earnings, which would represent a meaningful improvement from the 85% conversion achieved in fiscal 2026. Finance leaders and controllers watching this company should focus on the adjusted metrics, the $3 billion savings cadence, and the trajectory of North America Retail volumes, which declined 3% organically for the full year and are the key variable in the company’s return to growth thesis.
Bottom Line: General Mills fiscal 2026 is a textbook example of why GAAP reported earnings and adjusted operating performance can diverge dramatically in a year of significant restructuring and portfolio activity. The company lost money on paper and generated $2.17 billion in operating cash. Reading financial statements without understanding the adjustments is how operators and investors reach the wrong conclusions.