


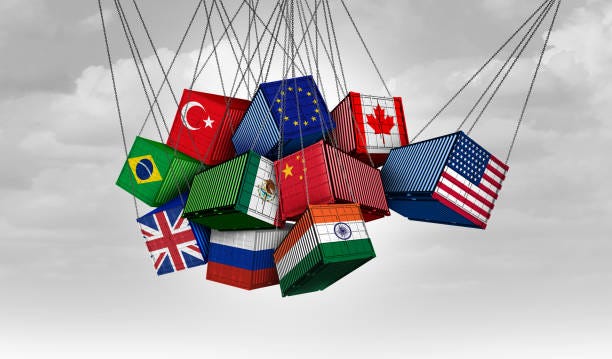
As tariff costs have become a permanent and material line item for retail and CPG businesses with global supply chains, the ability to quantify and benchmark tariff exposure has shifted from a customs compliance function to a core financial planning discipline. The most useful metric for this purpose is tariffs as a percentage of cost of goods sold — a ratio that contextualizes duty expense relative to the total cost base it affects and enables meaningful comparison across product lines, sourcing regions, and time periods.
Calculating this metric requires a clear view of the total duty paid across all import entries in a given period, divided by total COGS for the same period. Companies with diverse sourcing strategies may find significant variation in tariff exposure by product line — a situation that can inform prioritization of tariff engineering, duty drawback, or nearshoring efforts. Lines with the highest tariff-to-COGS ratio and the largest absolute duty spend represent the most financially compelling targets for cost reduction.
Chart: Illustrative tariff as % of COGS by sourcing region and product category under current Section 301 rates.

The benchmark exercise is most valuable when repeated quarterly and layered against the company’s gross margin targets. A business targeting 55% gross margins that is absorbing 10% of COGS in tariff costs has effectively pre-committed a meaningful portion of its margin budget to trade policy — a risk that deserves active mitigation rather than passive acceptance. Finance teams that model tariff exposure as a percentage of COGS are also better positioned to evaluate the financial case for supply chain diversification decisions.
Companies should also track this metric against historical periods to identify trend acceleration. A tariff-to-COGS ratio that has grown from 4% to 9% over two years is a signal of structural margin erosion that may not be visible in blended gross margin figures if it has been partially offset by price increases or cost reductions elsewhere. Isolating the tariff component enables more precise diagnosis and more targeted remediation.
Bottom Line: Tariffs as a percentage of COGS is the metric that turns a compliance cost into a financial risk that can be measured, benchmarked, and managed.